Although video is the preferred medium to promote businesses nowadays, custom graphics like infographics are still valuable to content marketing strategies. But creating a killer and shareable infographic takes great care and planning. However, don’t let the intricacies of making an infographic discourage you from posting one. Here are expert tips and tricks on how to create custom infographics!
How Can You Create Your Own Infographics?
1. Start with Your Topic and Create an Outline

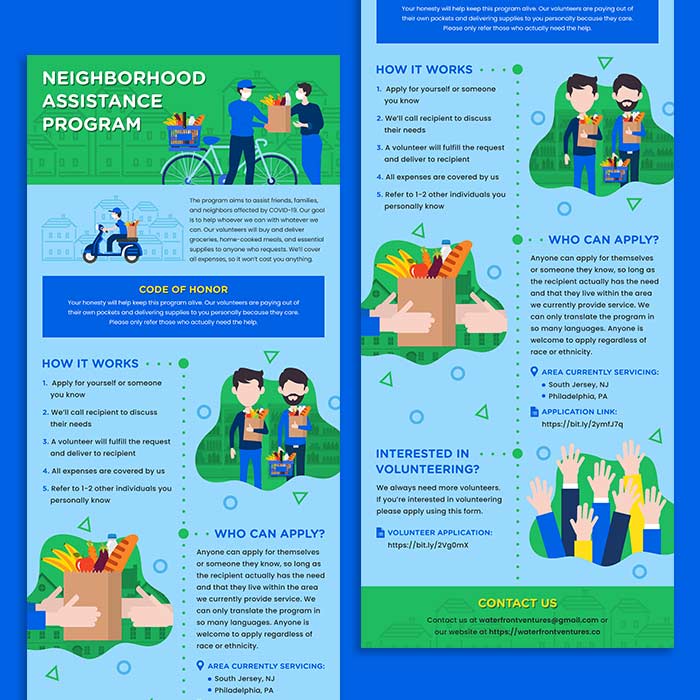
Making custom infographics aren’t an easy feat. But you can make it a smooth process by identifying your topic first and then writing an outline. Many love infographics because it’s long-form content condensed in a visual and digestible form. That said, your copy should be concise.
Plus, make sure you can tell a story without images yet. This way, your infographic has a smooth flow as the reader moves to your next point. Think of infographics as a way of telling a story. That’s what it should achieve.
In addition, review all information you want to add to your infographic. It can be tempting to put everything into one visual. Instead of including all data and text, make your infographic bite-sized or divide them into multiple infographics.
2. Find Infographic Inspiration, Illustrations, and Icons
Although graphic design software apps store templates in their system, looking at previous infographic designs doesn’t hurt. Looking at infographics before designing one helps you understand how others have crafted theirs. But if you have an envisioned design, scroll below for our tips on designing custom infographics.
Aside from viewing infographic inspiration, you also need illustrations and icons to complete your design. Most online graphic design software apps have these visuals. However, you can get them from other sources too.
You can download icons and illustrations from these sites (no attribution required):
- UXWing (Icons)
- Reshot (Icons)
- Icons8 (Icons)
- Undraw (Illustrations)
- Drawkit (Illustrations)
Share Your Data the Smart Way
Visit Penji's marketplace for custom designs


3. Use a Graphic Design Software
The final step in creating an infographic is designing it using design software. As I mentioned previously, graphic design apps have built-in templates. But you can make one from scratch. Plus, they store elements, such as icons, illustrations, colors, and fonts, making it easy to create infographics without leaving their software.
You can create custom infographics with these graphic design makers:
- Canva
- Visme
- Piktochart
- Adobe Express
- Snappa
7 Tips to Design Custom Infographics
If you want to give infographic design a try before letting experts take over the reins, here are some pro tips for designing a custom infographic.
Use Contrast on Colors and Fonts

Infographics are colorful. That’s on purpose because you want to entice viewers to read your infographic. But multi-colored infographics won’t work on every topic. You can keep it simple with your brand’s colors or stick to a pleasing palette.
If you need ideas for palettes, here are palette generators:
- Coolors
- Colormind
- Paletton
- Color Hunt
- Muzli Colors
Similarly, fonts should also follow this principle. Expert graphic designers use up to three different font faces. However, if you don’t want to think about which fonts go best together, you can use one font family and use three different weights.
Consider Size and Scale

If your infographic’s content is long, it could affect your visual content. Although infographics are image-heavy, it doesn’t mean you should have more images than text. It means you can play around with the elements’ sizes and scales to emphasize specific data or text.
Remember White Space

One graphic design blunder a non-designer can make is cramming elements into one section, leaving the canvas empty in some areas. You don’t want to make this mistake with infographics, especially if you’re presenting various data. You can avoid this by using graphs for data to avoid jamming text.
Create Flow with Arrows or Lines
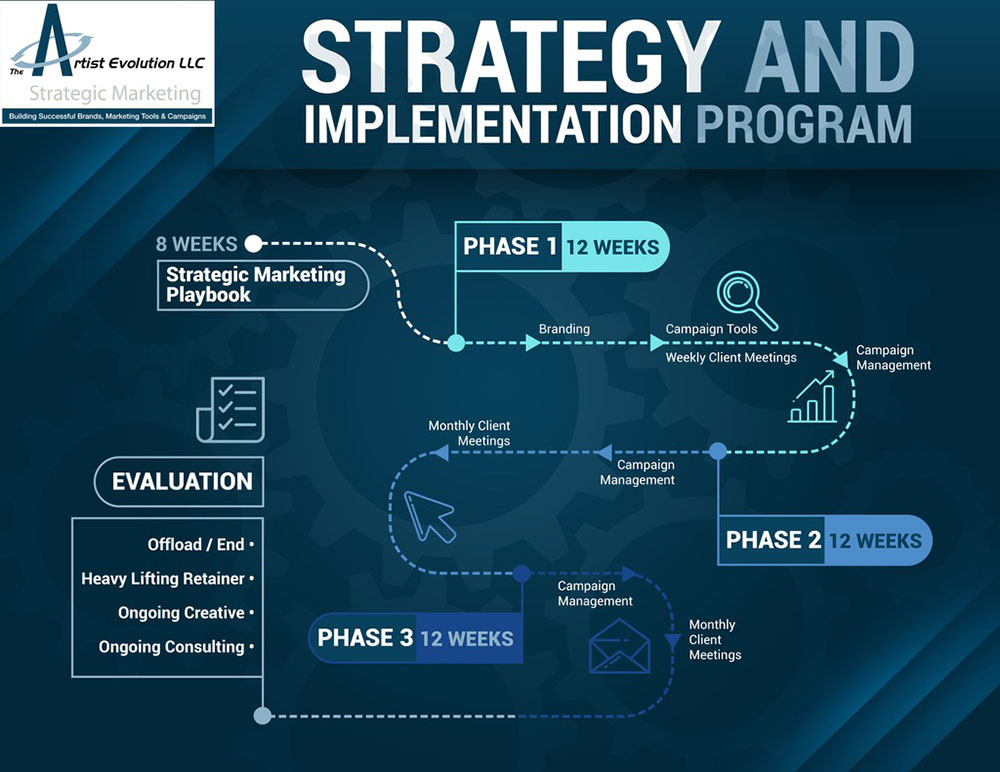
Telling a story is necessary for creating an infographic since you want to engage the viewer from start to finish. Arrows are great indicators to tell a story. But if arrows can disrupt the flow, lines are an excellent alternative.
Keep the Audience in Mind

As interesting as infographics are, expect that not everyone will be compelled to read about them simply because it’s not their area of interest. That said, design with the audience in mind. You should consider fonts, illustrations, images, and data to make the infographic interesting and enticing to your specific audience.
However, if you’re in the health, wellness, tourism, or food industries, you will have a broader audience. That said, it’s best to visualize data and keep it entertaining with icons and illustrations.
Select the Right Graph or Chart

Charts and graphs create variety in your infographic if you’re presenting data. But it’s important to remember which chart or graph to visualize your data. Bar and pie charts are the most popular types to add to an infographic. If you’re comparing data, bar charts are your best bet. However, pie charts are for proportion.
Don’t be limited by these two choices. You have other options, such as line and radar charts, scatter plots, and a Sankey diagram.
Add Your Logo, Website, and References
When you’re done designing your infographic, don’t forget the most important section: the footer. This is where you include your references, logo, and website. It shows that you’ve done your research. Plus, when people share your infographic, they know the source.
How Can Penji Help with Your Infographics?
Custom infographics can be tedious to make, considering you need to craft content and save images and illustrations to make it compelling. But what if you could skip the infographic design process and let professional graphic designers take over?
Penji is one of the premier unlimited graphic design services. You can request infographics, marketing materials, branding assets, and more! When requesting infographics, you can start by signing up for a plan. Once done, you get access to the Penji dashboard to submit your first request!
Remember that Penji can make the graphic for you, so prepare a design brief with the content that our designers should include in your infographic. From there, you can get a draft within 1 to 2 days! But if it needs tweaks, not to worry. Any Penji plan includes unlimited revisions. Our designers ensure that you’ll get a design you’ll love!
If you want Penji to be your design partner, you can subscribe to a plan here!
About the author

Katrina Pascual
Katrina is a content writer specializing in graphic design, marketing, social media, and technology. In her spare time, she writes monthly personal blogs to practice her craft.
Table of Contents
- How Can You Create Your Own Infographics?
- 1. Start with Your Topic and Create an Outline
- 2. Find Infographic Inspiration, Illustrations, and Icons
- 3. Use a Graphic Design Software
- 7 Tips to Design Custom Infographics
- Use Contrast on Colors and Fonts
- Consider Size and Scale
- Remember White Space
- Create Flow with Arrows or Lines
- Keep the Audience in Mind
- Select the Right Graph or Chart
- Add Your Logo, Website, and References
- How Can Penji Help with Your Infographics?