Wouldn’t it be great if you could know what your customers are likely to buy? If only you could know which marketing strategies provide optimum results for your store before implementing one. Imagine knowing probable issues before customers can complain to your customer support.
You don’t have to wish for a magic wand or a third eye to get all these; all you need is the analytics tool. Here’s how to read Shopify analytics for beginners:
Why Use the Shopify Analytics Tool?
Taking a data-driven approach to your e-commerce business is a smart decision. The best way to do this is by leveraging Shopify analytics. The main benefit of doing so is knowing how your buyers behave and interact with your content. With insightful data, you can also do the following:
- Improve your shop’s user interface to make shopping more convenient for buyers.
- Help you develop effective marketing strategies online and offline.
- Upsell to your best customers.
- Create product bundles and special promotions for your brand.
- Help you increase your store’s average order value.
Reading Shopify analytics can answer many questions about your customers, finances, and marketing campaigns. Start reading them now, and we’ll show you how.
How to Read Shopify Analytics
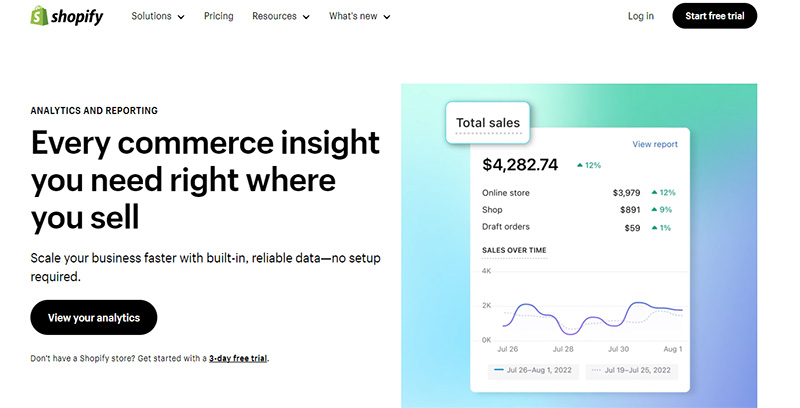
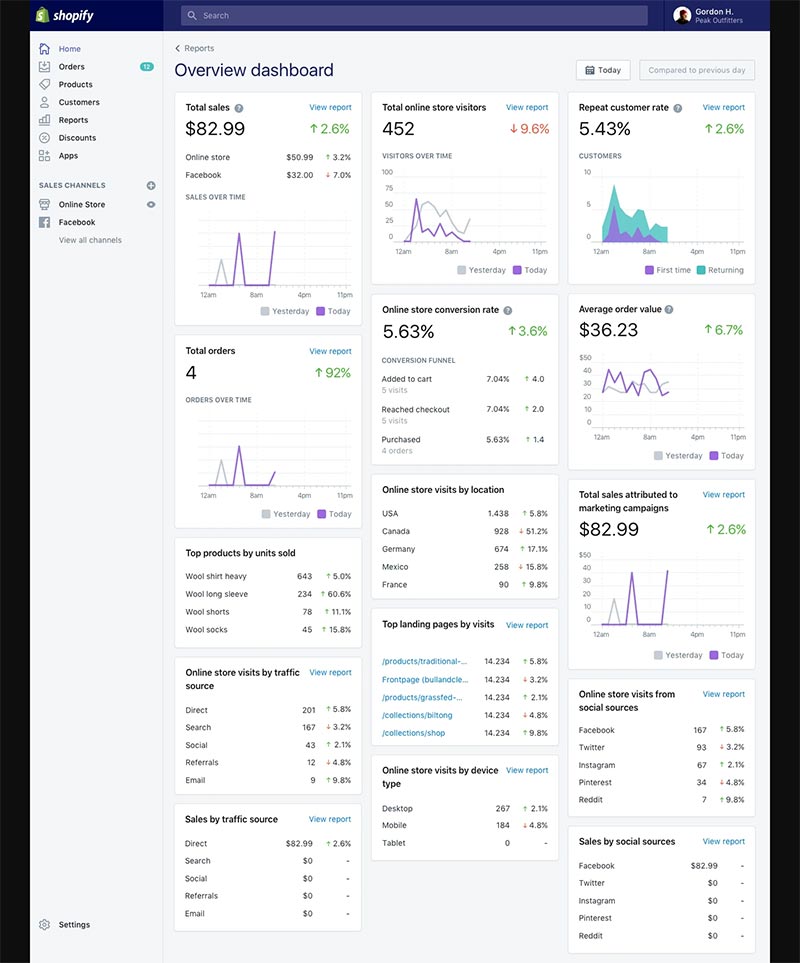
First, log in to your Shopify admin account and go to the Analytics dashboard. You will be redirected to the Overview dashboard, which displays the data for today with a comparison to yesterday’s. You’ll also see a summary of your key metrics, which include sales, orders, conversion rates, and traffic.
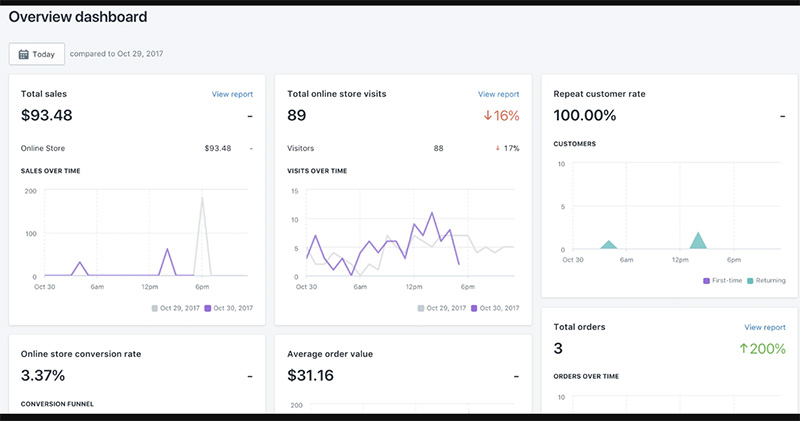
On this dashboard, you’ll also find the most valuable metrics regarding your store’s performance and your customers’ behaviors. You can choose the date range of the data you want to see. Click on the date menu and choose the date range you want.
It gives you the option to select a preset range, like Quarter to date. You can also set a custom range by choosing dates on the calendars. From the overview dashboard, you can do the following:
- Check recent sales, review, and compare them with past date ranges.
- Compare your sales channels’ performances.
- Find out what your average order value is.
- Track and monitor where your visitors are located.
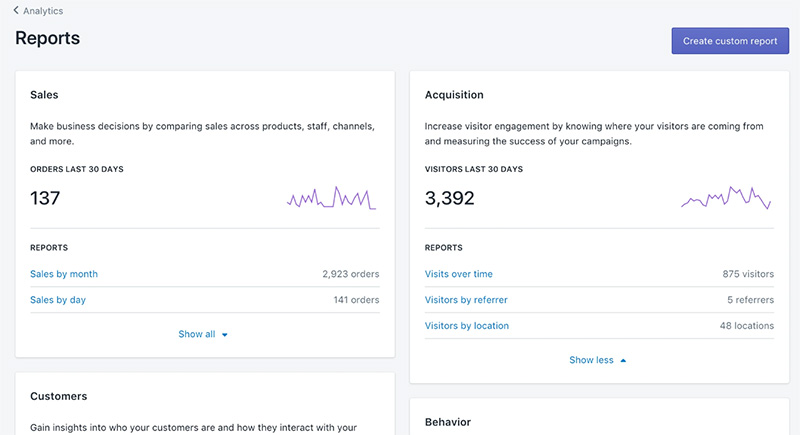
The Reports Overview
Shopify also provides you with a reports overview. You can click on each to get deeper insights into several aspects of your e-commerce store. The key reports are as follows:
- Overview: this shows you your store’s general performance.
- Marketing: this shows you information on traffic sources and data about your marketing campaigns.
- Finance: this shows you details about sales, payments, and taxes.
- Acquisition: This gives you insights into where traffic is coming from.
- Customers: this gives you data on your customers’ behavior and other demographics.
These reports will show you crucial metrics that can help you make data-driven decisions. They will also help you improve and optimize your strategies to increase your chances of growth and success.
The Sales Report
Next, click on the Finance report. You’ll find several insights into your e-commerce store’s financial performance here. Below are some of the most crucial:
- Total Sales: this will show you a clear view of your store’s total earnings over a specified date range.
- Average Order Value: this will show you your customers’ shopping habits, how much they are spending, and the average amount they spend in a single transaction.
- Sales Trends: this helps you track and monitor the trends, such as periods of growth or the ups and downs per season.
- Taxes: this will help you understand tax-related data, taxes collected on sales, shipping, refunds, and discounts.
- Payments: this will show you your customers’ payment methods and processing fees.
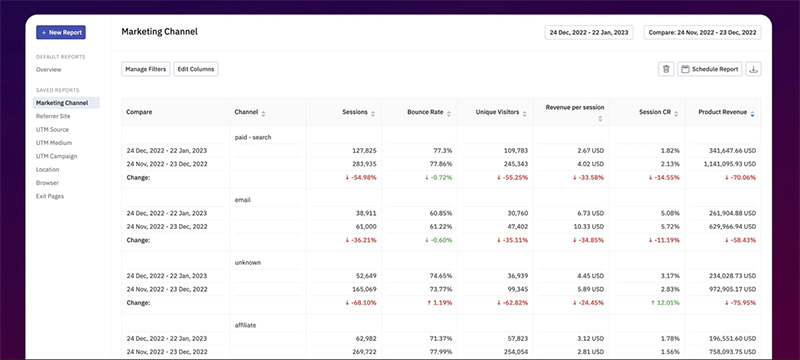
The Marketing Report
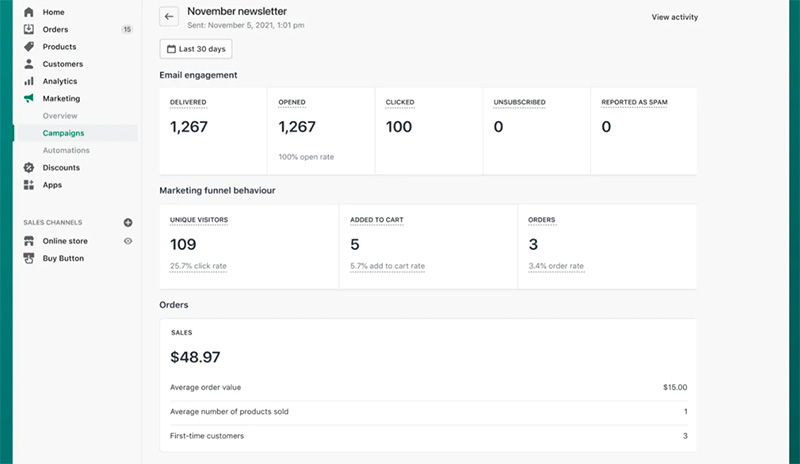
This section deals with traffic sources, which gives you insights into where your store’s visitors are coming from. This data can help you create the best marketing strategies, optimize your advertising spending, and maximize the effectiveness of all your promotional efforts.
- Organic Search: this refers to your store’s visitors who found you through search engines like Google, Yahoo, or Bing. This tells you how well your store ranks in search results. This will help you identify what keywords your store is ranking for and let you refine your SEO strategies.
- Paid Search: this refers to the visitors who landed on your store through your paid advertising campaigns such as Google Ads or Bing Ads. This will help you assess the return on investment (ROI) of your advertising spending.
- Social Media: this refers to the visitors who arrive at your store via social media platforms such as Facebook, Instagram, or Pinterest. This will help you craft marketing strategies on these channels.
- Direct Traffic: this refers to the visitors who directly type in your store’s URL into their browsers. This is a good benchmark for brand recognition and customer loyalty.
- Referral Traffic: this refers to the visitors arriving at your store via external blogs and websites. This can help you identify which sources refer traffic to your store for future partnership and collaboration.
The Conversion Rate Report
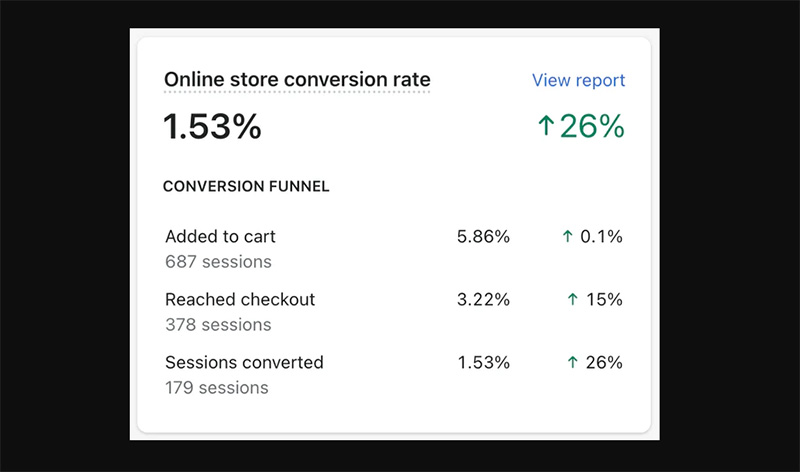
This overview is a vital e-commerce metric that shows your website’s effectiveness in converting viewers into paying customers. This indicates the percentage of website visitors who have taken your desired action, most commonly purchasing.
Below are a few reasons the conversion rate is crucial to business:
- It tells you how your store is performing. The conversion rate indicates how effective your website and strategies are in convincing people to buy from you.
- It helps you gauge customer engagement by showing you how effective your product descriptions are, how well your website is designed, and how your strategies are performing. This will show you where you need to improve.
- It helps you assess the ROI of your marketing efforts. A higher conversion rate means your campaigns are worth every penny you spend.
The Customers Report
Understanding the customers report gives you vital information on the following:
- Customer Behavior: the report will give you a wealth of information on how your customers behave while in your e-commerce store.
- Customer Demographics: this data will give you an idea of who your customers are, with info such as gender, age, and location. This will allow you to craft strategies that are relevant to them.
- Geographic Insights: the report will show your customers’ location and help you customize your marketing strategies more effectively.
- Purchasing History: this will help you identify your customers’ product preferences, buying frequency, and total lifetime value. This data will help you develop customer retention efforts and enhance the customer experience.
The Products Report
Shopify analytics will show you how individual products are performing in the product report. This will help you identify which products are popular and which need more attention. Here are some critical data you can get from this analytics section:
- Sales: this will give you details on each product’s performance, including the number of units sold, average order value, and the total revenue generated.
- Inventory Data: this will show you the stock levels of your products. This will help you avoid running out of stock or overstocking.
- Bestsellers: this will help you identify which of your products are your bestsellers. This will tell you where your marketing efforts need concentration.
- Low Performers: the report will show you your products that aren’t selling well. This allows you to create corrective actions, such as reducing prices, improving product descriptions, or creating targeted campaigns.
- Performance Trends: this allows you to track the performance of your products to help you identify seasonal trends or any changes in customer preferences.
The Custom Reports and the Analytics Apps
While Shopify has built-in analytics and reporting tools, it still gives you the option to integrate custom reporting solutions and analytics apps. Here is a list of the key aspects of custom reports and analytics apps:
- Advanced Reporting: you can find plenty of third-party analytics apps that provide advanced reporting features if you feel that Shopify’s aren’t enough. This way, you can create customized reports specifically tailored to your business.
- Integration: these analytics tools easily integrate with your Shopify store.
- Customization: these analytics apps offer more customization options that let you choose your specific metrics and data points for more focused reports.
- Real-Time Data: there are apps that can provide you with real-time data analysis that lets you see your store’s performance as it happens.
- Cross-Channel Analytics: these tools provide you with data gathered from various sales channels, which include your physical store (if any), online store, and social media platforms.
Setting Your Goals
One of the most important parts of attaining business success is setting clear goals. This involves defining SMART: Specific, Measurable, Achievable, Relevant, and Time-bound. Once you have gathered enough data from Shopify analytics, you would want to establish your goals.
Here are the primary reasons to set clear goals:
- It helps you make data-driven decisions. The data you gathered from Shopify analytics allows you to make informed decisions on where your business is heading.
- It helps you specify certain aspects of your business, such as how much you want to increase your sales, define the timeframe to do this, and which products or customer segments to focus on.
- Helps you track your store’s progress.
- It helps you align your business’ mission and maintain your brand’s relevance.
- It helps you avoid frustration and demotivation when you set unrealistic goals.
Continuous Monitoring and Optimization
The next step in learning how to read Shopify analytics is to put it to good use by continuously monitoring and optimizing your store. Regularly check your analytics to help you see your progress toward your set goals and objectives.
This includes consistent observation and analysis related to sales, customer behavior, traffic, and more. Once you gather enough information from your continuous monitoring, you can proceed to optimization. This involves enhancing and refining several facets of your business. This can include products, marketing, and customer engagement strategies, among others.
Doing these provides you with the following benefits:
- It helps you adapt to changes in a highly volatile e-commerce landscape. This means you remain competitive in the dynamic world of online selling.
- It helps you become more efficient as it lets you allocate resources better. It allows for impacting where you direct your efforts and investments.
- Helps you satisfy your customers when you know and understand their behavior, thus enhancing their positive experiences.
- It lets you be relevant to your industry by letting you know which offerings people will buy.
- It makes your store profitable when you make the right decisions through continuous monitoring and optimization.
Stay Updated
Educating yourself and keeping updated with knowledge in Shopify analytics is essential to your journey as an e-commerce store owner. It makes you competent in your field and gives you an edge over the competition. If you’re interested in gaining more knowledge, the following are recommended sources:
Shopify Academy: Shopify has its own educational platform that offers courses and tutorials on Shopify and Shopify Analytics.
Shopify Help Center: Shopify’s Help Center offers in-depth insights into how to read Shopify analytics and many other concerns in using the platform.
Online Courses and Tutorials: You can find a wide array of websites that offer training courses and tutorials on Shopify. A few examples include Udemy, LinkedIn Learning, and Coursera.
Blogs and Forums: You can gain wisdom from Shopify sellers and users via blogs and forums. These will give you valuable insights as they have hands-on experience handling Shopify stores.
Professional Services: If you want customized guidance, you can always go to professional consulting and expert services.
Shopify Community: Get tips, tricks, hacks, and advice from fellow Shopify sellers through the Shopify Community. You can get expert advice, pose questions, and share your experiences with other users.
Final Thoughts
Learning how to read Shopify analytics requires time and effort. It needs your undivided attention, but know that the benefits will make all your troubles worthwhile once you learn the ropes.
For all your branding and design needs, you can count on Penji. Watch our demo video here to learn more. Click here to get our designers started. For more savings, use the promo code GETPENJI25 today for 25% off on your first month!
About the author

Celeste Zosimo
Celeste is a former traditional animator and now an SEO content writer specializing in graphic design and marketing topics. When she's not writing or ranking her articles, she's being bossed around by her cat and two dogs.
Table of Contents
- Why Use the Shopify Analytics Tool?
- How to Read Shopify Analytics
- The Reports Overview
- The Sales Report
- The Marketing Report
- The Conversion Rate Report
- The Customers Report
- The Products Report
- The Custom Reports and the Analytics Apps
- Setting Your Goals
- Continuous Monitoring and Optimization
- Stay Updated
- Final Thoughts