Most humans are visual learners, so trust me when I say infographics are an excellent tool to communicate with your target audience. These 25 real infographic design examples will tell you why.
1. History of Life
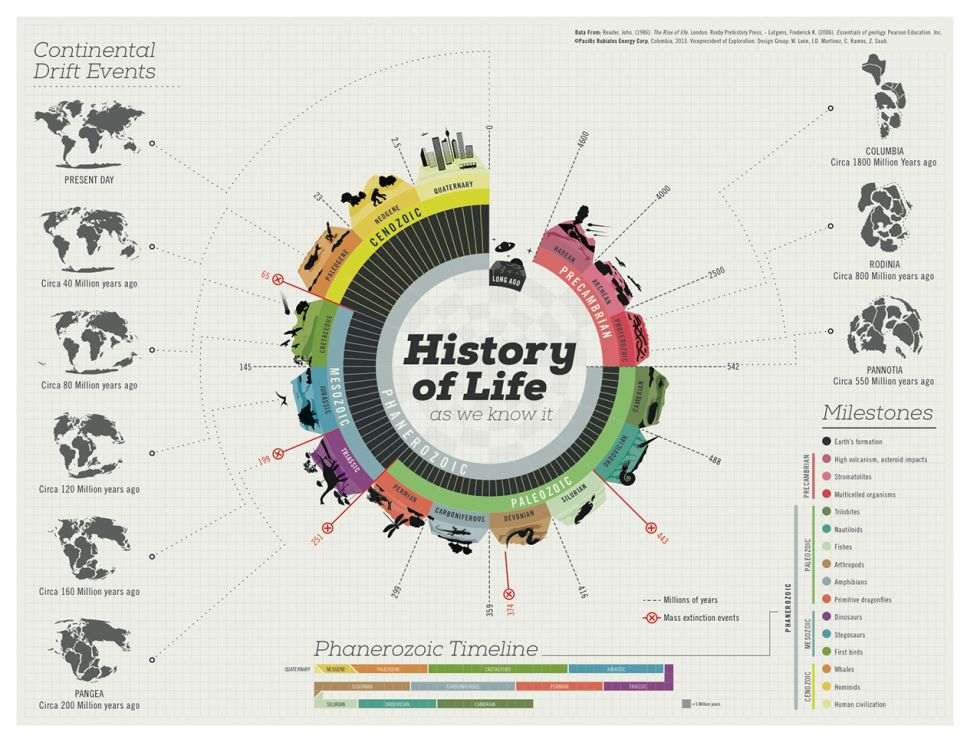
Here’s a simple infographic on the History of Life. It’s easy to understand the timeline from the beginning until the present because each era is represented by various colors. Furthermore, the legends on the lower right also make it easy to comprehend.
2. Beatles Songs
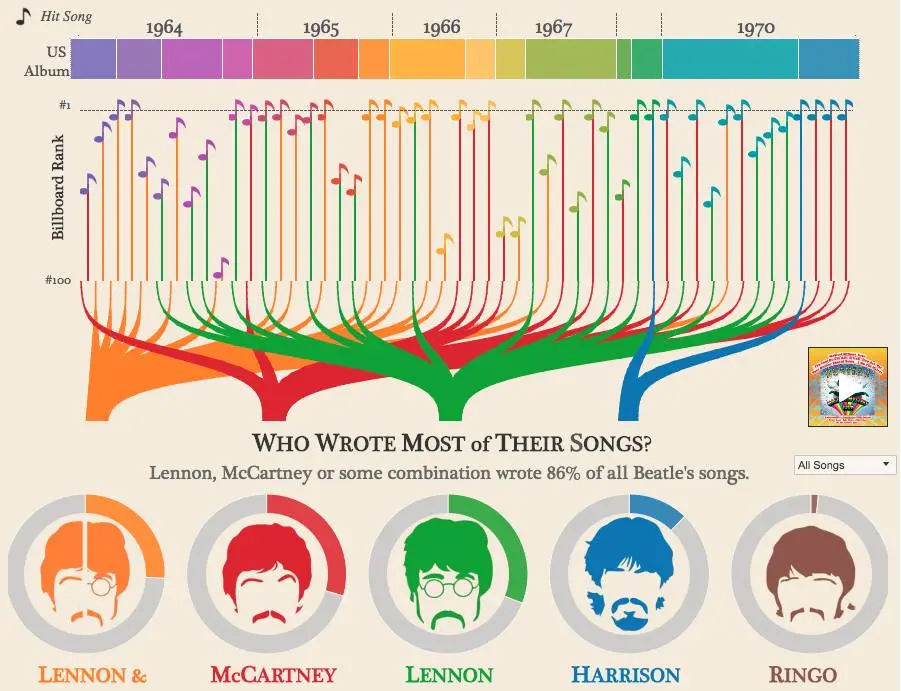
The way data is presented on this Beatles infographic is unique. From the branches, you can immediately tell who of the five stars wrote most of their songs.
[in_content_ads gallery="social-media-content" logo="off" title="Stop using templates" subtitle="Custom social media posts get more shares than overused design templates." btntext="Design this for me!" btnlink="https://penji.co/pricing/?affiliate=J2O5AB8RAR3386837"]3. Rules for Startups
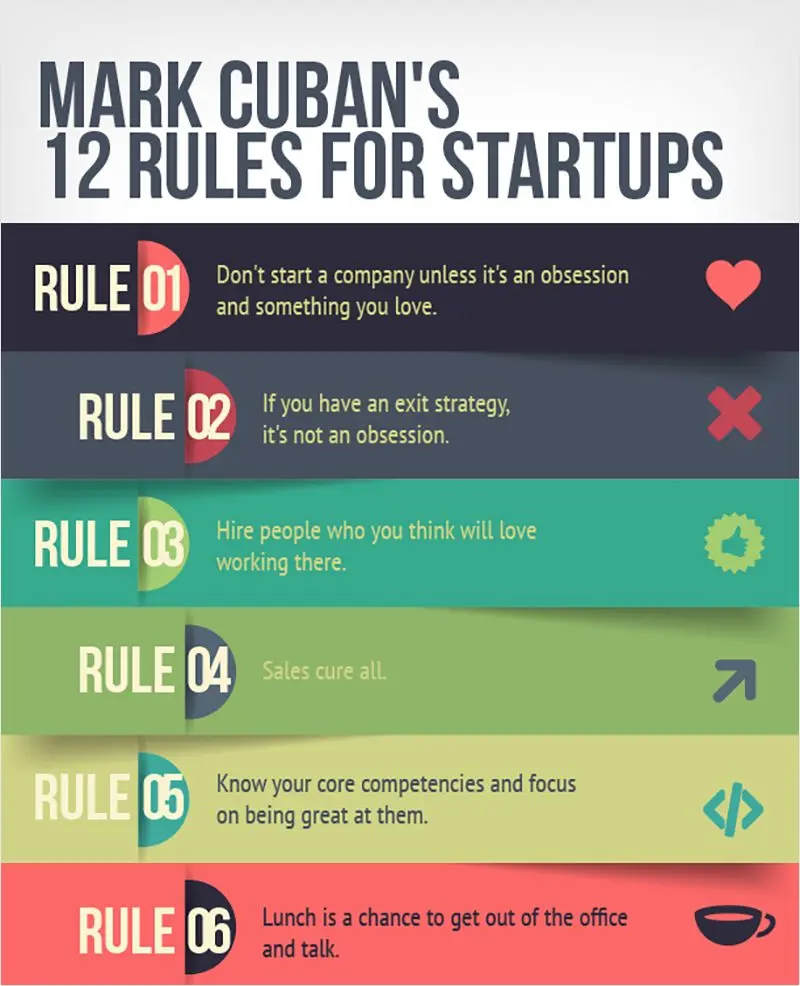
Muted colors are in when creating infographics, and this is the perfect example from Entrepreneur. What this infographic lacks in images, it makes up for in colors.
4. Avengers
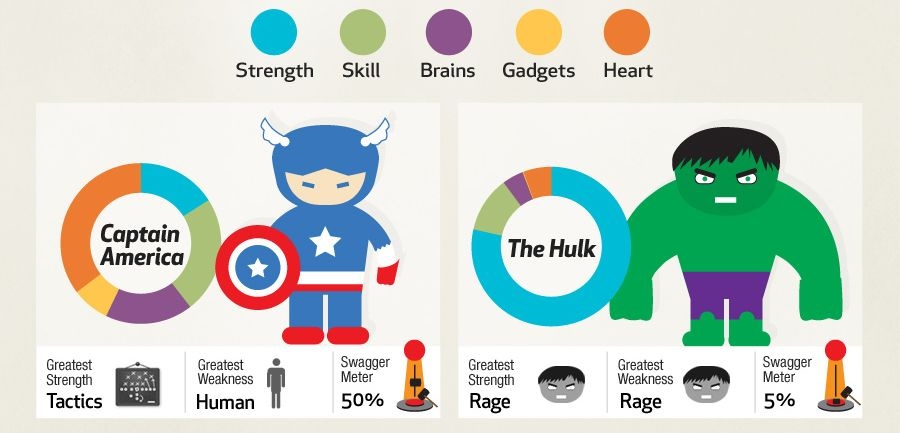
Even kids can quickly dissect information on this infographic. Lemonly did a great job comparing both Avengers’ heroes through cartoon figures, colors, and icons.
5. Exercising Entrepreneurs
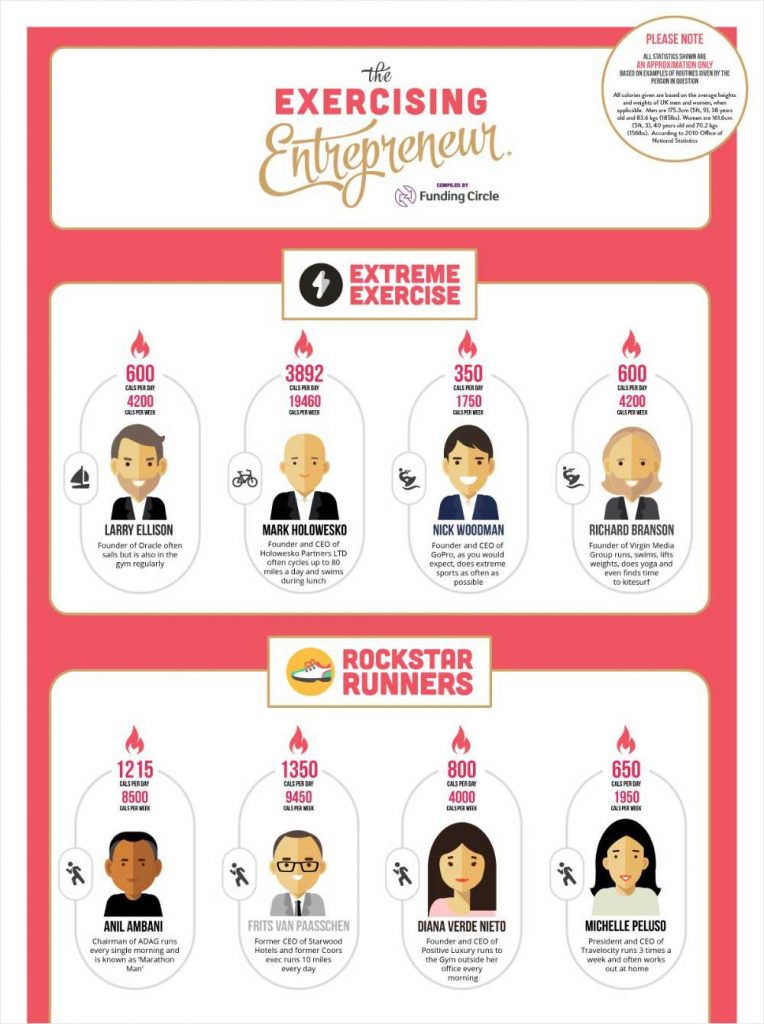
Creating a balance between texts and graphics is vital for cohesion. Here’s an example from Virgin Media Group on exercising entrepreneurs.
6. Human Storage
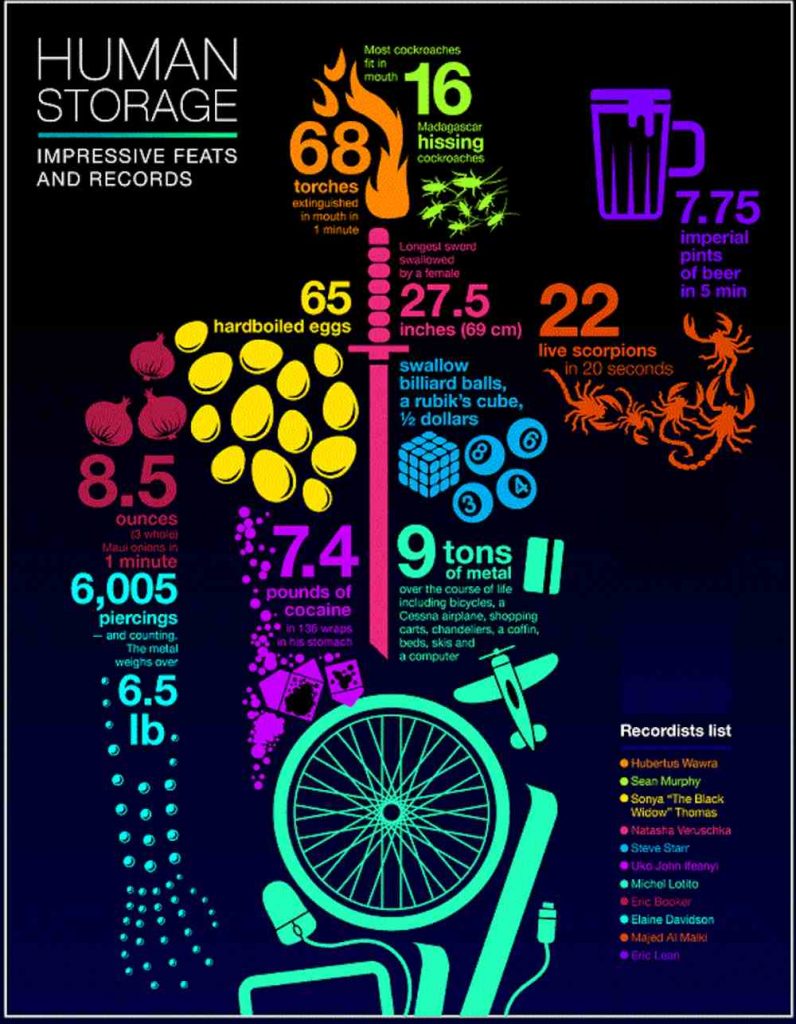
Guinness’ infographic works well with bright contrasts and colorful symbols.
7. The ABC of Design
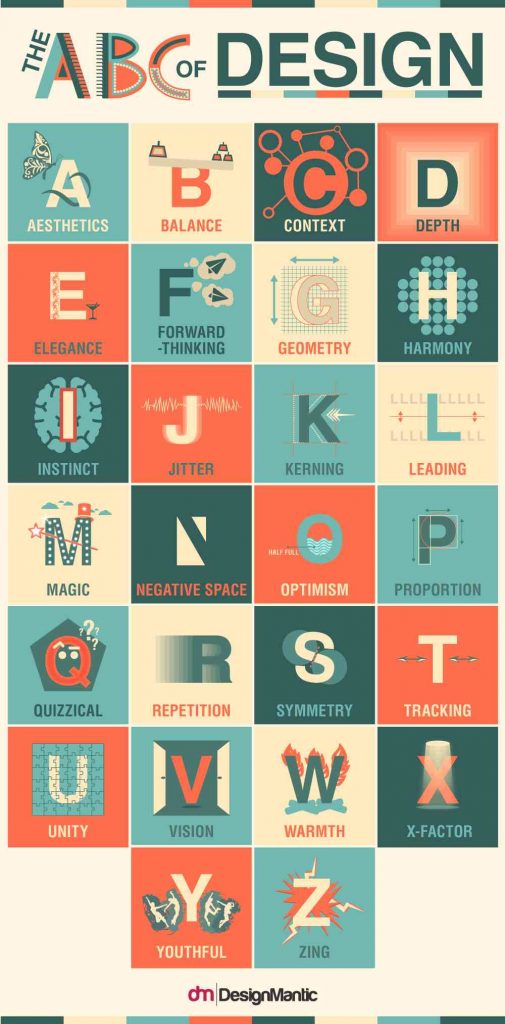
The ABC of Design is like a periodic table of elements but with a more creative touch. The letters A to Z lead your eyes in a methodical order. Lastly, neutral colors separated by bright oranges also keep it from being dull.
8. Universe
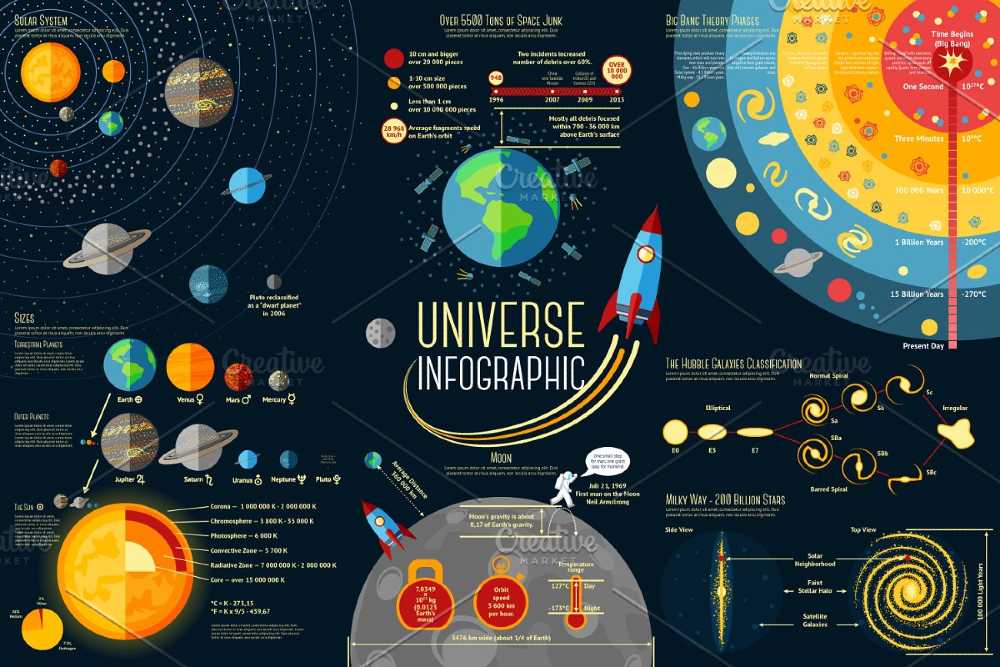
Simplifying complicated topics is easy with an infographic, and this example from Creative Market is one you should follow. Although it may seem like a lot is going on here, there’s perfect proximity between each category, making it easy to scan.
9. The Visual Web
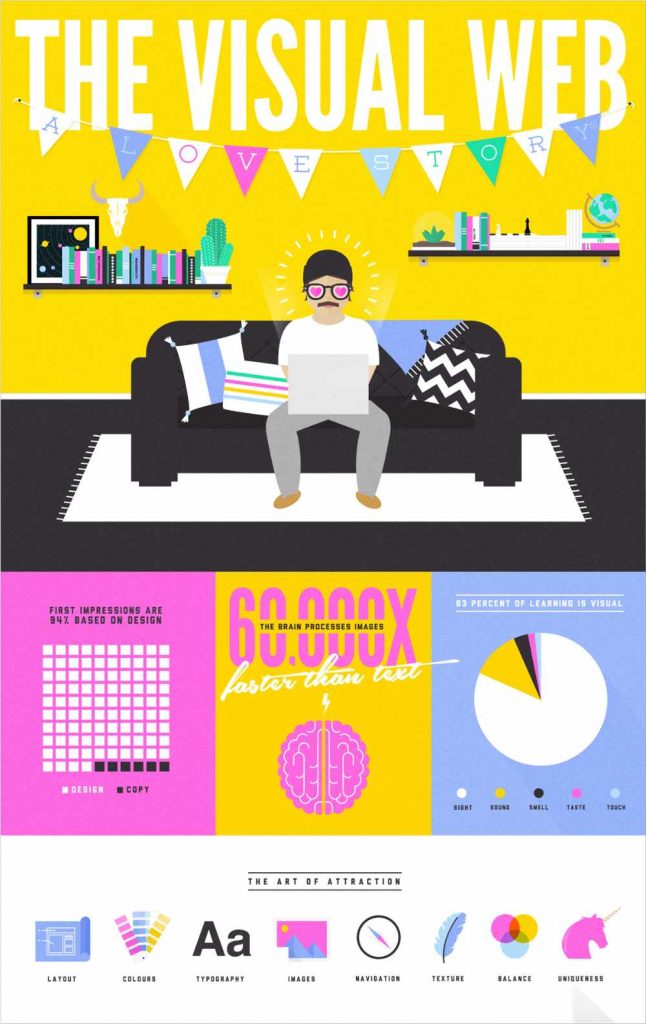
The rule of infographic design is to visualize your data or statistics to make it more appealing. And Bandwagon did just that. The way statistics and figures are presented is creative and not boring at all.
10. Data Scientists
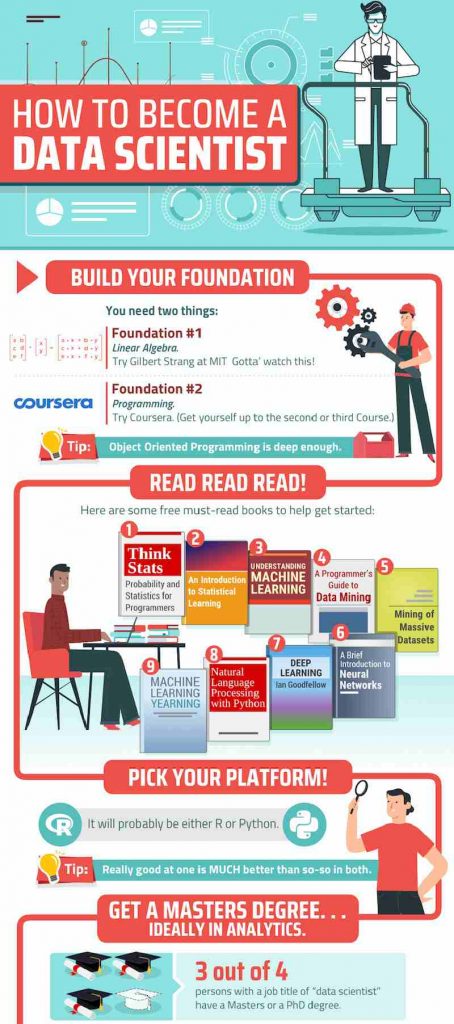
The infographic title is one factor that encourages users to read, despite the graphics. In this example, the title stands out. Plus, the use of a red line is an excellent strategy to lead readers through all steps chronologically.
11. Best Countries in the World
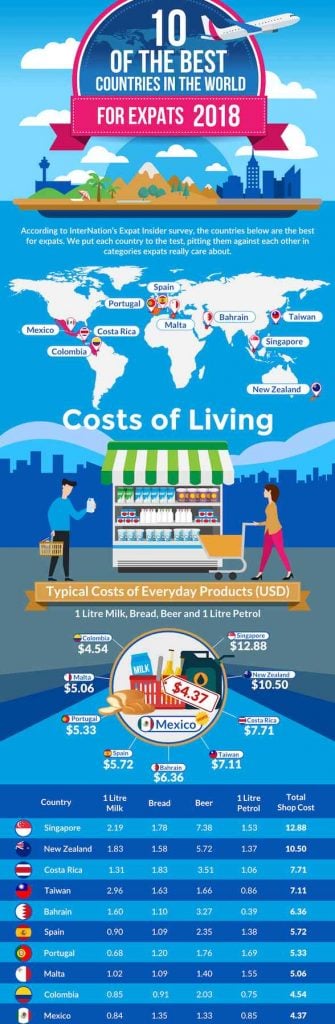
Sticking to just three primary colors is recommended for an infographic. However, if you need more, pick other shades of the colors, just like this example from MNoriega.
12. Online Dating Tips
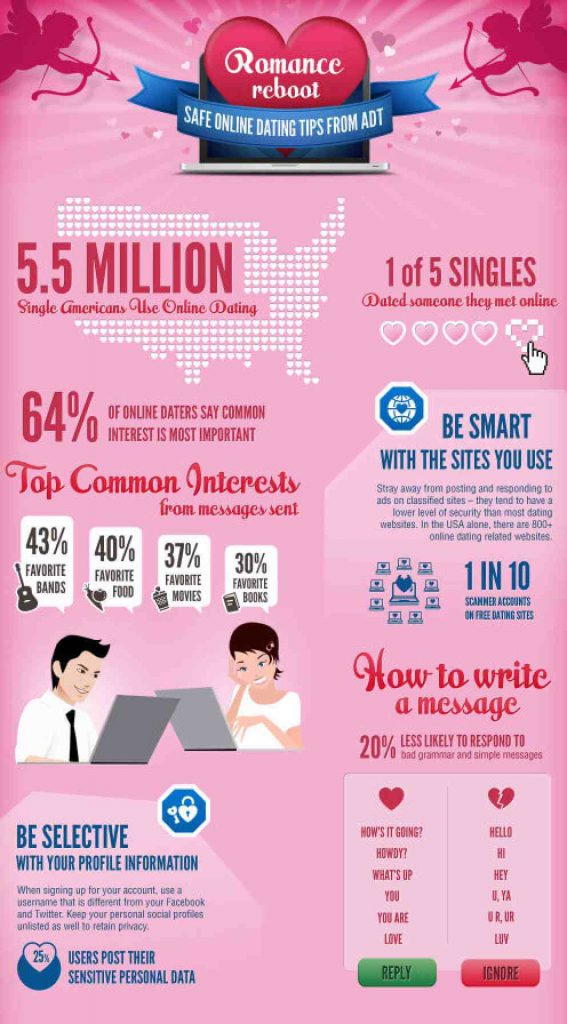
While the title is the most critical part of an infographic, the subheadings also break up information effectively. Check out how this ADT infographic is easy to scan even with various subtopics.
13. Selfie Method
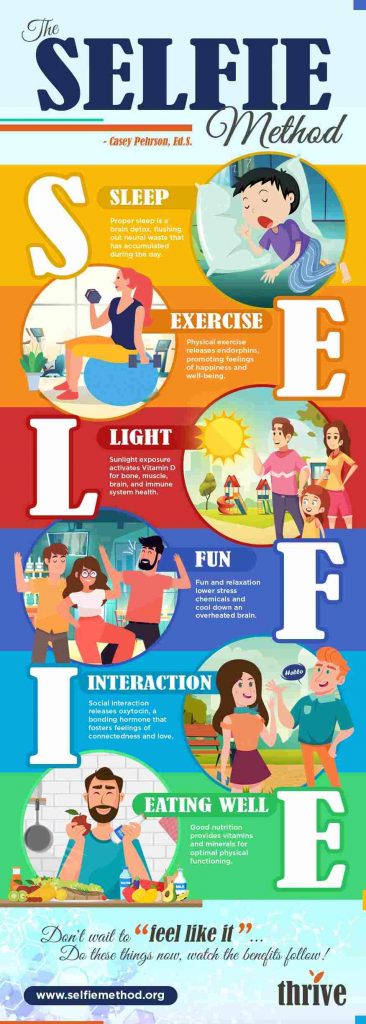
One essential ingredient in infographic design is to show, not tell. Create a storyline that makes the topic more exciting. This example presents the different selfie methods with accompanying caricature images that depict the method.
14. Steps to Onboard Employees
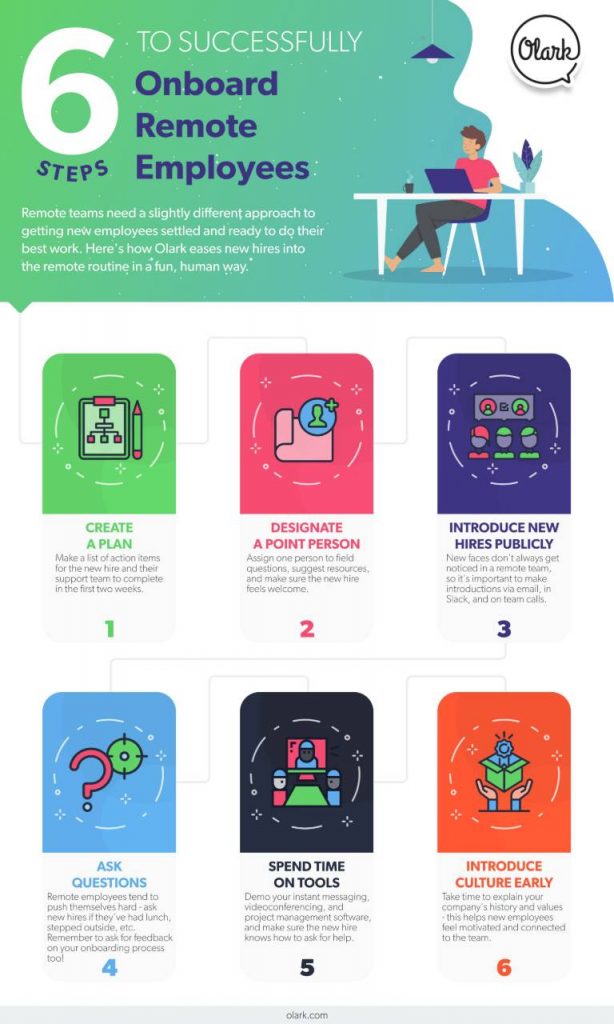
This six-step guide to onboard employees infographic has a clean and straightforward design. The primary heading is the main star of the show, and each step is displayed in an organized way.
15. Learning Out of Poverty
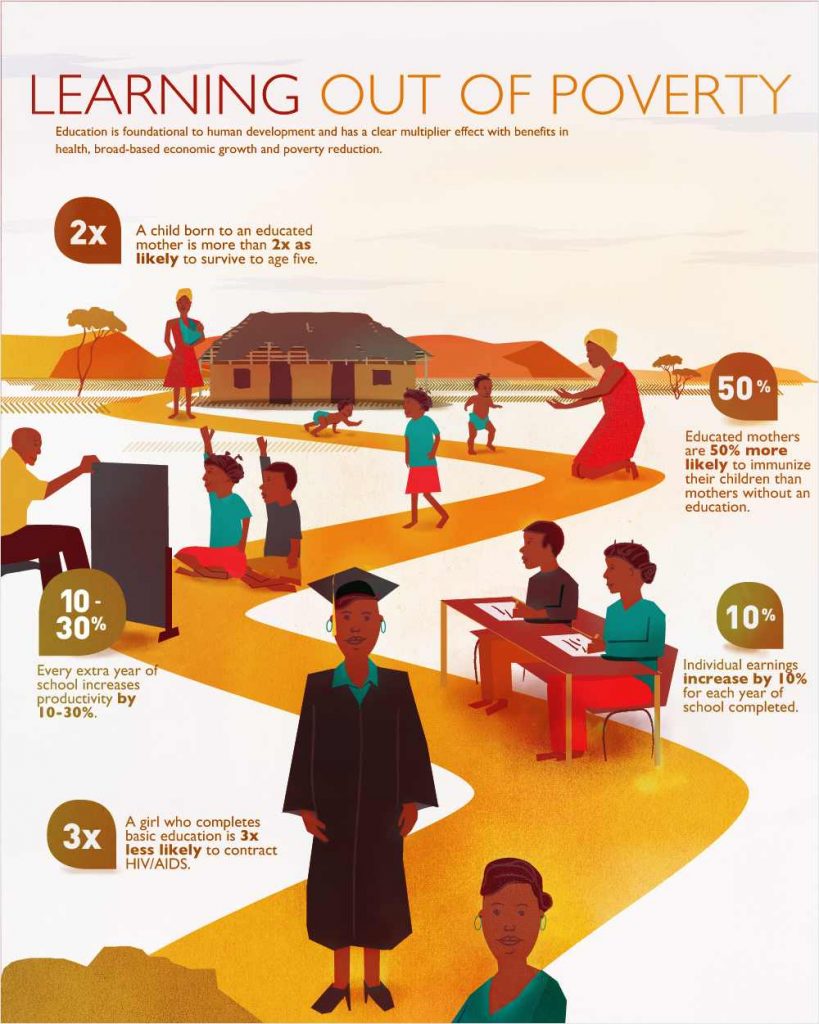
One way to lead to eyes to the direction you want is to use road-like concepts. Using lines and paths is useful in creatively visualizing data.
16. US Education vs. the World
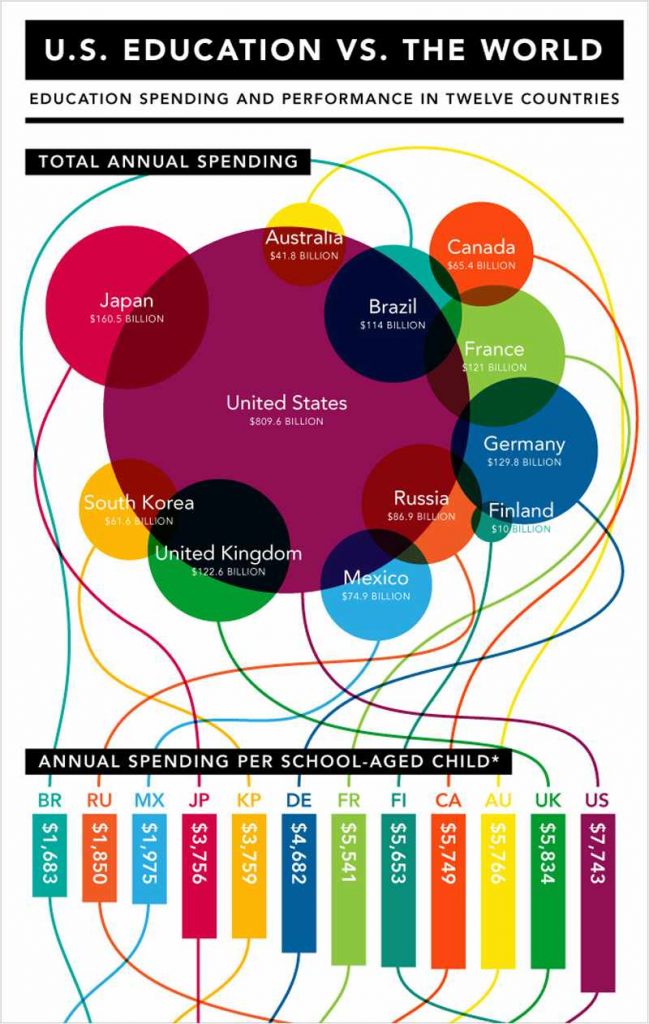
This infographic design from USC Rossier banks on shapes, borders, and colors to break up information.
17. The Bitcoin Beat
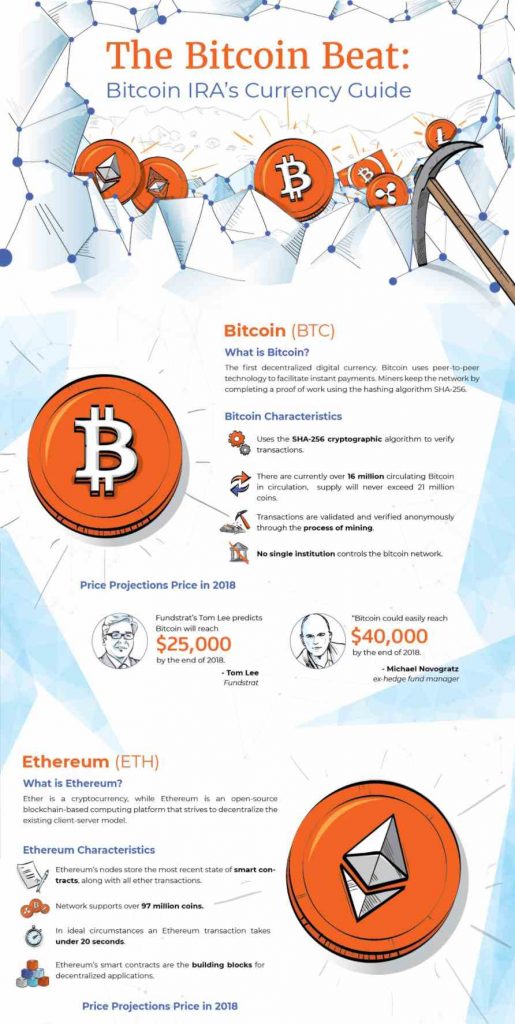
Relying on typography too much isn’t recommended. Moreover, if you have to gear towards a text-oriented infographic, balance it out with icons and symbols. This infographic presents each sentence with an icon and the main statistical takeaways with face icons.
18. Solid ABM Team
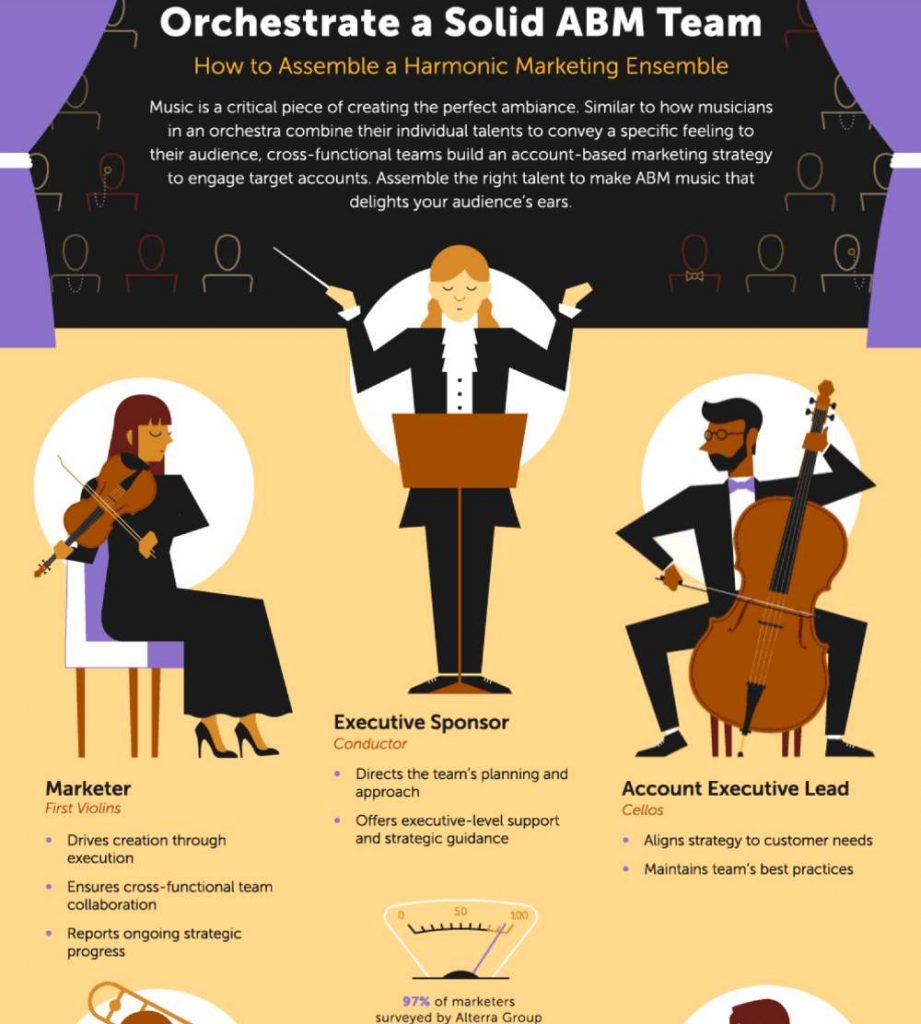
Always give more visual weight on the most crucial information, just like this Marketo infographic. This is in GIF form, and the musicians invite the eyes to read info underneath them.
19. Startup Statistics
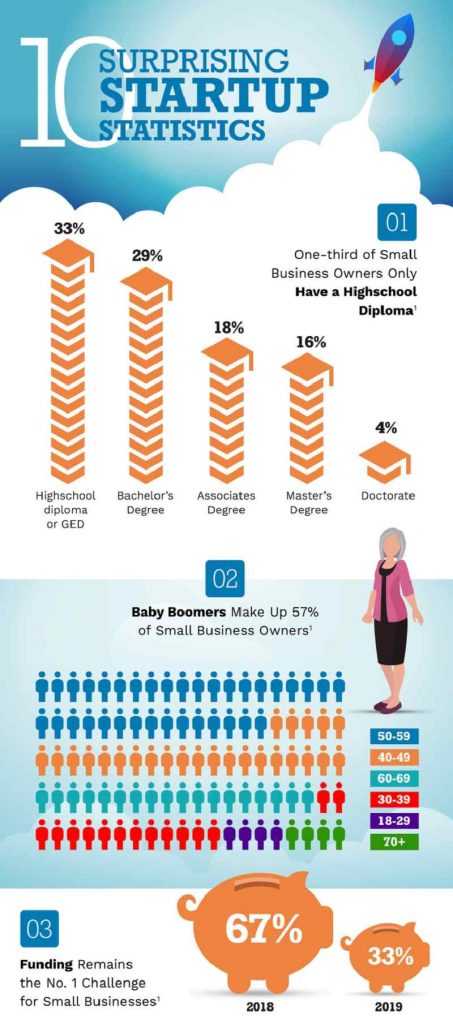
Using graphs and charts to present statistics and data is sufficient. Nevertheless, it doesn’t hurt to dress it up a bit. Take a look at this 99designs infographic.
20. Impact of Visual Content
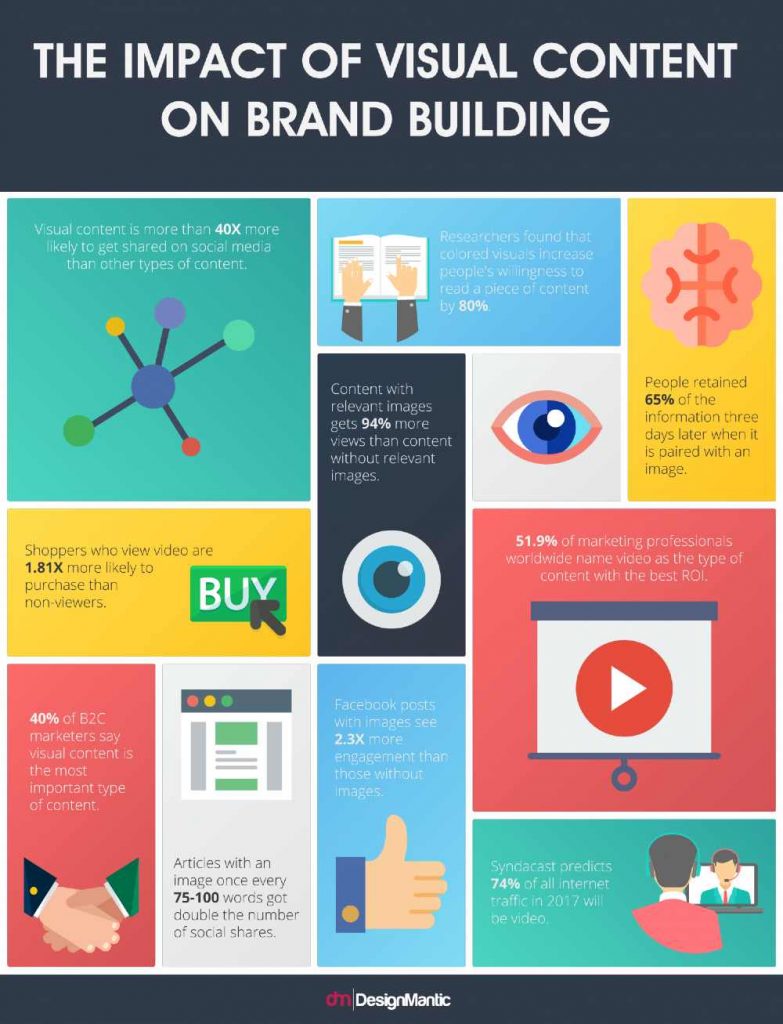
Here is also another way of showing stats and data without having to use quantity. In this example, it’s easy to digest information because of scale. The grid-like approach segregates various info, and the different candy colors make it attractive.
21. World Debt
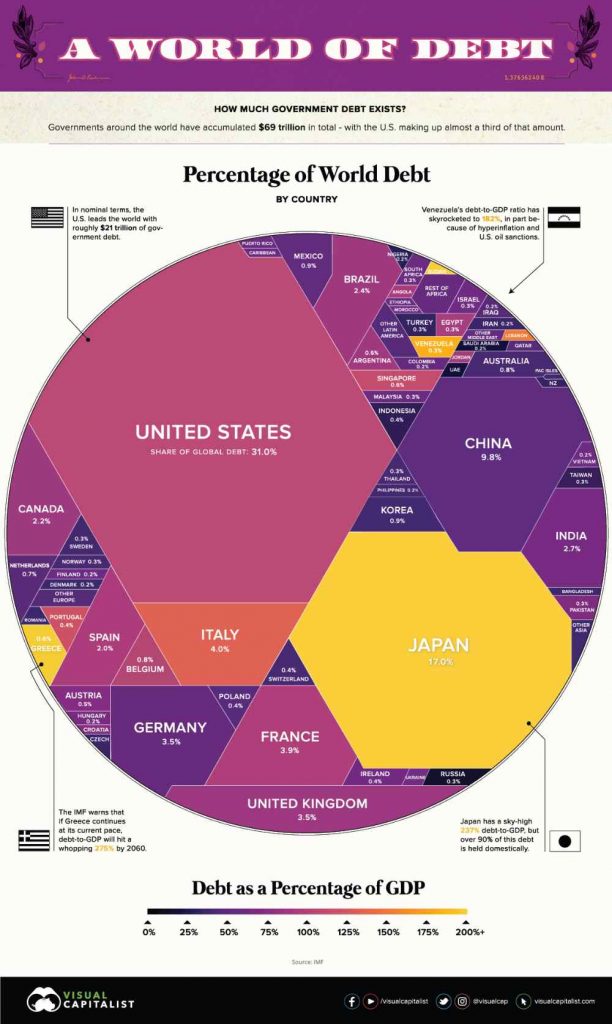
Compressing all countries’ debt into one infographic might seem like a daunting task. However, Visual Capitalist did a stellar job with this. It shows the mere shape of the world, and a geometrical figure represents each country, making it easy to process.
22. The Health Vault
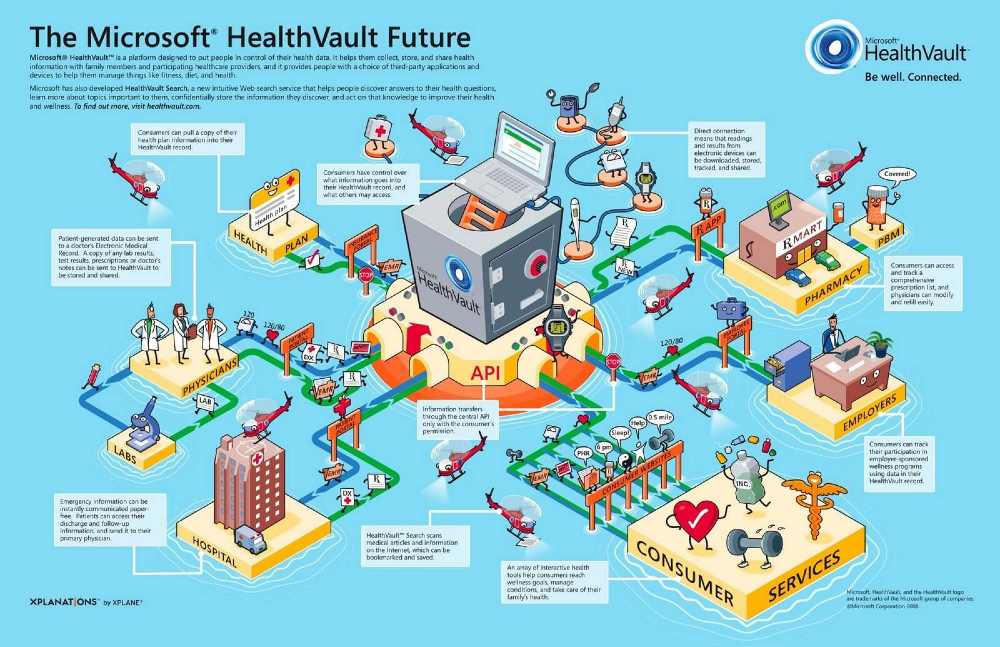
This is one of the most graphical infographic designs on the list. Microsoft highlighted how the healthcare industry collects, stores, and shares data through a series of networks. Ultimately, although it’s heavy on the visuals, it doesn’t take the focal points away from the end-to-end providers and consumers.
23. Top Jobs in the US
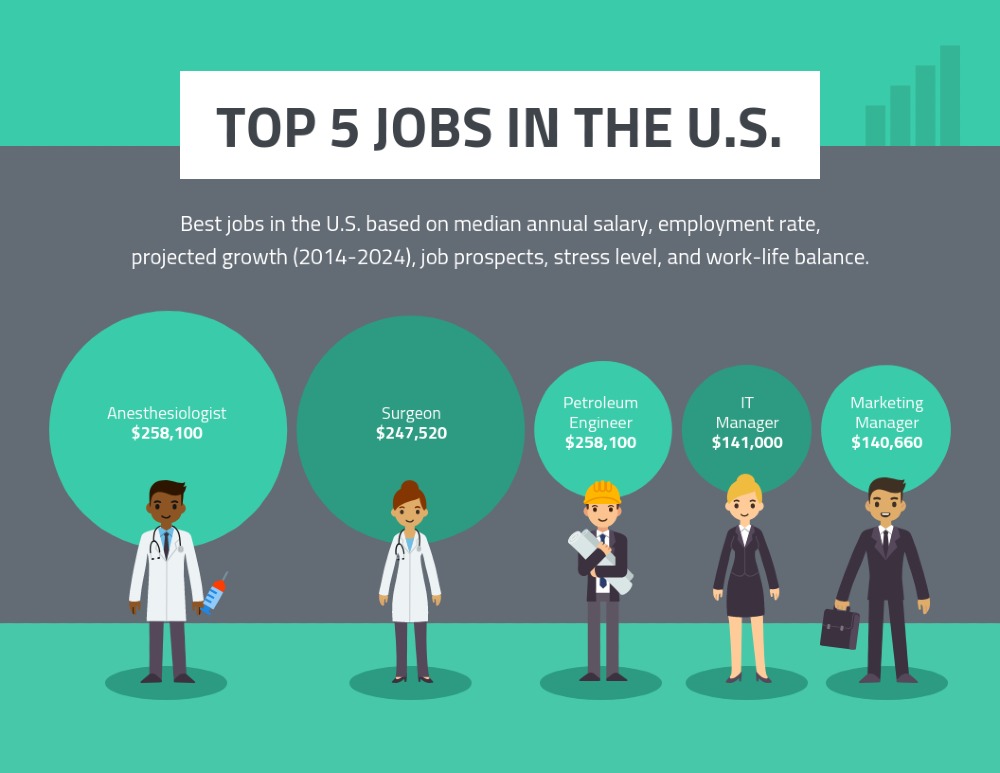
Simplicity is also key in making a killer infographic design. Venngage relies on typography and various shades of green to compare five jobs in the US. The title has the heaviest font, the subheading has the second heaviest font, and the job details have the least. Even the size of the circles is indicative of which one has the highest and lowest salaries.
24. Adobe Pawtraits
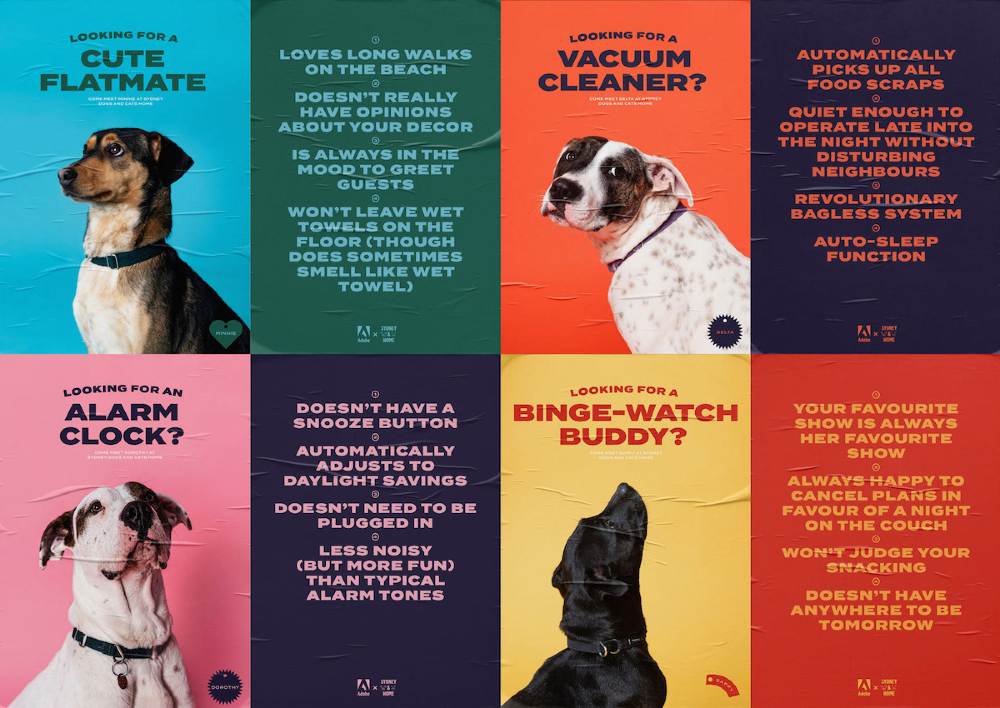
Contrast and strong typography are what make this Adobe infographic stand out. Plus, it plays with texture through the crumpled effect on the graphics. The alternating presentation of the dog photos and texts is a smart design approach.
25. Graphic Design Trends
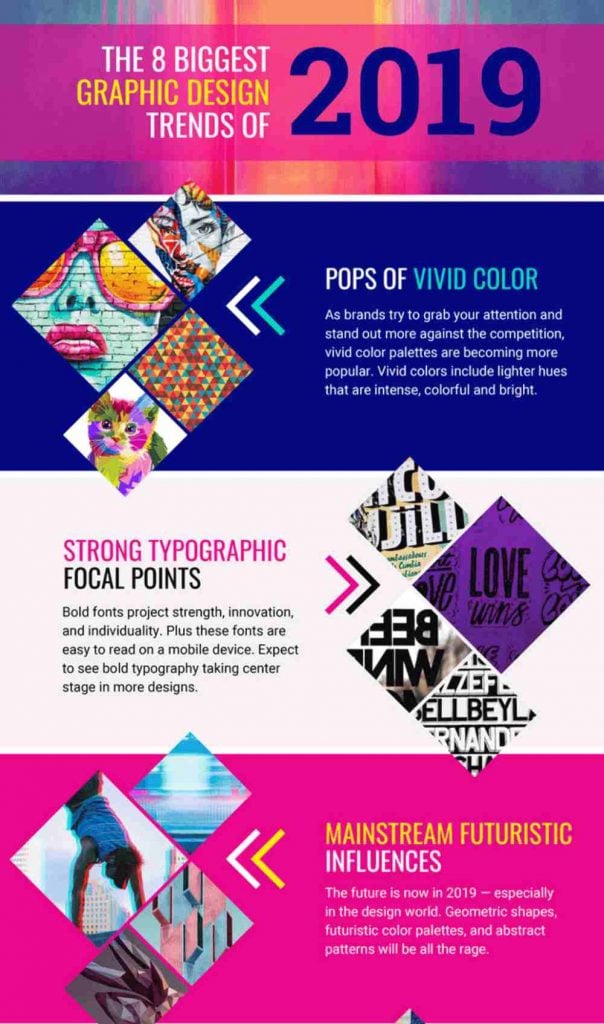
This infographic design has a little bit of everything – vivid colors, geometrical shapes, visuals, and typographic focal points. Moreover, although vertical infographics are typical, this one is different from the rest. It’s extremely easy to process and everything about this example is eye-candy.
5 Steps to Request an Infographic Design
Once you work with Penji’s infographic designers, ensure that you know the steps when you want one made. Before you do, check the list below:
- Outline your infographic’s goal.
- Collate the essential information for your infographic.
- Visualize your infographic through storytelling.
- Select the icons, symbols, or images you want your designer to include.
- Incorporate your branding on the infographic (colors, icons, mascots, logos, etc.).
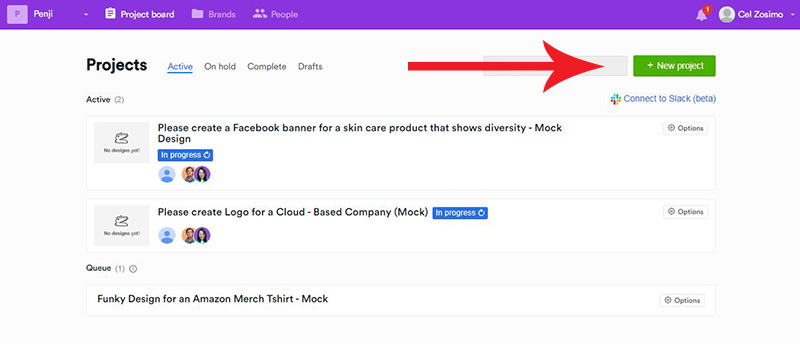
Step 1: Create
Log in to your Penji dashboard and click on the +New project button.
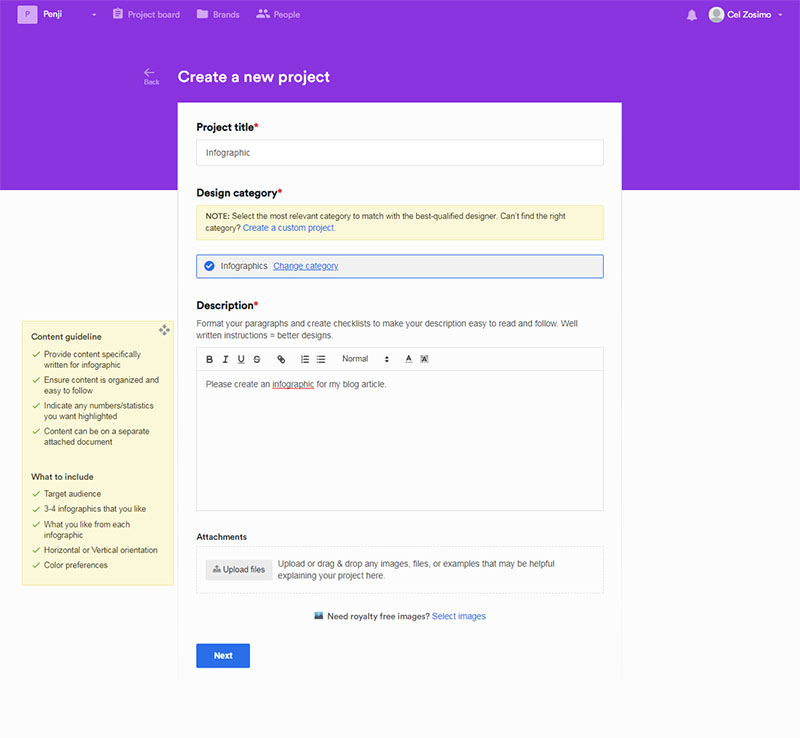
Type in the title of your project and select the design category. Under Marketing, select Infographic. Fill in the description box with the details of your project. You can add attachments such as files or links that you want the designer to use as references. Click Next.
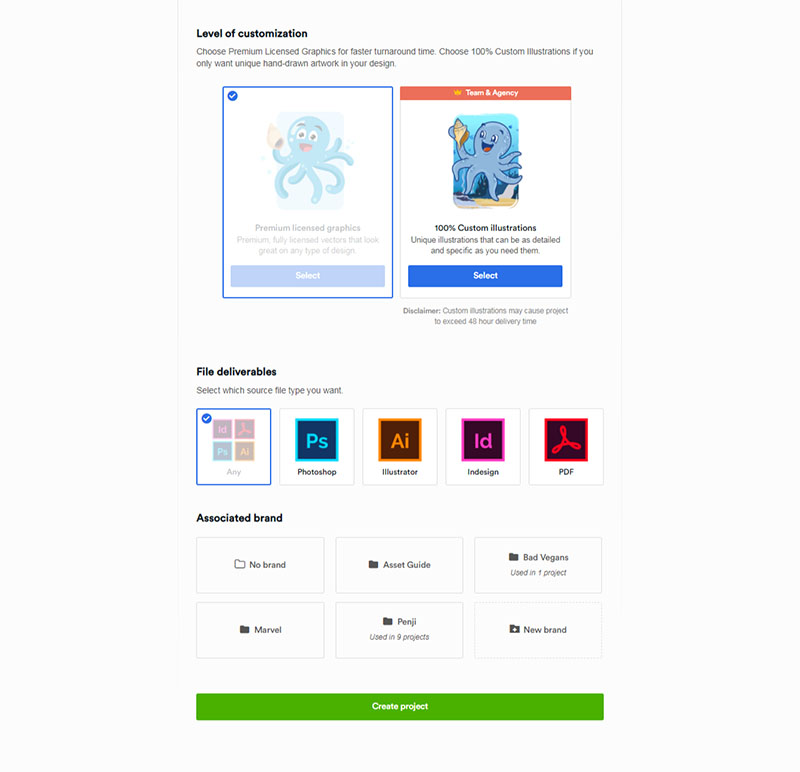
Choose the level of customization and file deliverables. Our Team and Agency plans allow you to request for custom illustrations. Select this if you want one made for your infographic. The file deliverables let you choose which file type you want your project to be done.
You can also store your brand assets in a folder under the Associated brand section. Upload your brand guidelines like logos and color schemes to this folder. Next time you need them, you only have to click on the folder for use in your subsequent design requests. Click Create project.
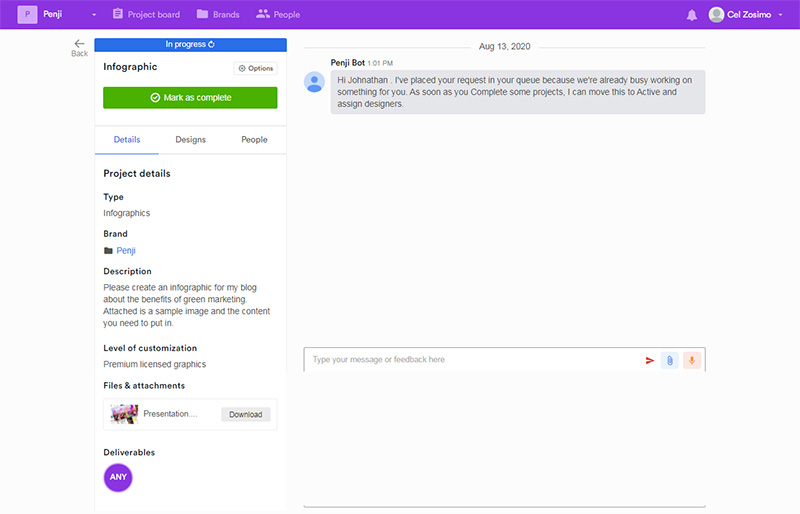
Our system will automatically assign the best infographic designer for your project. This is also where you can write additional comments to your designer.
Step 2: Revise
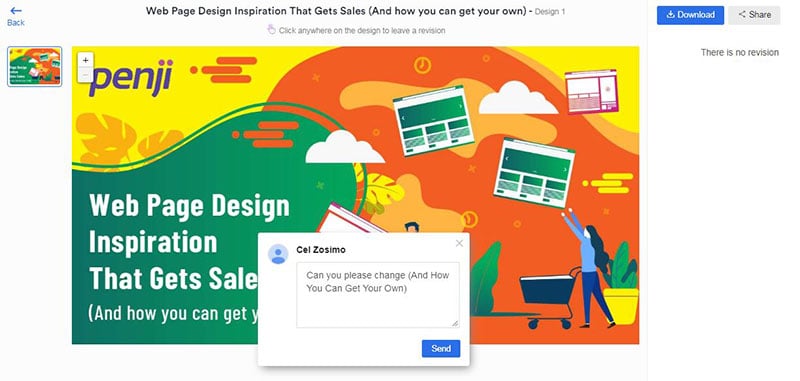
After about 24 to 48 hours, you’ll receive the initial draft for your review. If you want to have revisions made, just direct your pointer to the areas where you want the changes done. Type in your message and click on Send.
Your designer will then work on your revisions within 12 to 24 hours. Our unlimited graphic design service also gives you unlimited revisions. You can send as many revisions as you need to, we make sure that the design you get is the design you want.
Step 3: Download
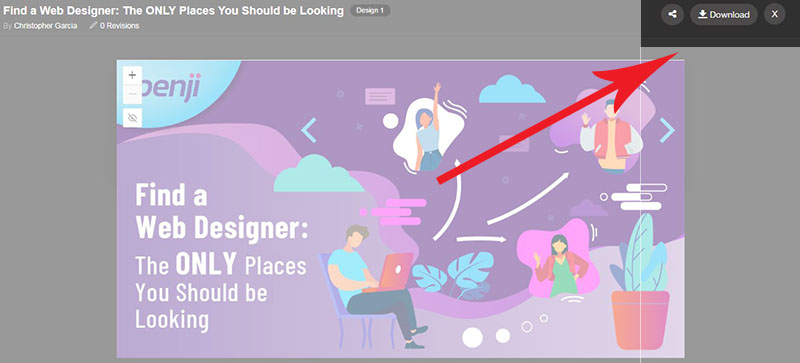
Once you’re happy with your infographic, you can download it. You get full ownership of the design and it is stored in our system. You can get access to it anytime you need to.
Are you ready to try quality and affordable graphic design?
Sign up for one of Penji’s plans and try the convenient custom design platform. Here’s a 15 percent discount to get you started.
About the author

Table of Contents
- 1. History of Life
- 2. Beatles Songs
- 3. Rules for Startups
- 4. Avengers
- 5. Exercising Entrepreneurs
- 6. Human Storage
- 7. The ABC of Design
- 8. Universe
- 9. The Visual Web
- 10. Data Scientists
- 11. Best Countries in the World
- 12. Online Dating Tips
- 13. Selfie Method
- 14. Steps to Onboard Employees
- 15. Learning Out of Poverty
- 16. US Education vs. the World
- 17. The Bitcoin Beat
- 18. Solid ABM Team
- 19. Startup Statistics
- 20. Impact of Visual Content
- 21. World Debt
- 22. The Health Vault
- 23. Top Jobs in the US
- 24. Adobe Pawtraits
- 25. Graphic Design Trends
- 5 Steps to Request an Infographic Design
- Step 1: Create
- Step 2: Revise
- Step 3: Download
- Are you ready to try quality and affordable graphic design?