Infographics are useful for making complex concept simple. When you simplify your approach, you are more likely to hold audience attention. Interactive visuals that create a wonderful user experience can be tricky. However, by taking a planned approach you can combat that.
A step by step approach when creating your infographic can increase organization. Design organization improves your overall infographic design. A structured and pretty layout is needed for complex data. If not, your infographic can get messy.
Remember, these visual presentations can be used for both online an in house. Therefore, determining your infographic’s destination changes the layout. With these tips, you can be sure your infographic has the best impact.
What Makes a Good Infographic?
Creative infographics have the following:
- Organized Design
- Visual Storytelling
- Easy to Understand
Organized Design
Creating an organized layout influences your viewer’s relationship with the infographic. A disorganized layout cannot properly display important data and facts. It is not a good design in that your message will not be understood clearly.
To avoid this, you need structure. Meaning, your infographic will need to involve partitions between certain snippets of information. Allowing information to stand on its own makes it more impactful. Moreover, sectioned out data removes distractions. Your eye has an easier time focusing on the statistic, blurb, or fact.
Furthermore, some data is just more eye catching, or more simply, important. For data that has a jaw dropping affect, you can bet that is what will influence your audience the most. Allow these facts to have even more emphasis. For instance, emphasis can be boldened underlined text.
Additionally, try using directional elements throughout your custom infographic. Directional elements help move the viewer’s focus. To be more specific, the movement of the viewer’s focus is more controllable. This allows the flow of information to be understood easier.
Infographic Elements:
- Arrows
- Bulleted Lists
- Sections
- Diagrams
- Flowcharts
Check out this example from Venngage!
Visual Storytelling
Primarily, visual storytelling is a concept that should not be underestimated. Having social media content or branded materials that tell a story are so important. This is gives your brand an edge with your target audience, or helps build unity in the workplace.
To expand, visual storytelling is the narrating through the use of different forms of media. Moreover, with the rise of social media and content marketing, infographics are just as useful online as they are in house. Hence, creating a stronger narrative with your image increases your brand strategy.
To elaborate, you can use photos, videos, illustrations and graphics to convey your message. Forms of media are much more attention grabbing than big bodies of text. Giving your infographic variety in how information is conveyed holds audience attention.
Social media moves quick. With that, you have to be sure you are spicing up your forms of content. Nevertheless, whether this is your website or social media, make sure your content changes as frequently as their attention.
With this, better visual storytelling creates a better user experience. Therefore, when the experience is better, you can bet your audience will return for more content. Check out our storytelling steps below!
Visual Storytelling Steps:
- Create an eye-catching headline.
- Develop a catchy tagline or one sentence summary that will stick with your audience.
- Use an upper section to describe the problem, procedure or policy.
- You can use a directional element. Add two section that explain the effects of this problem, or what can happen with this procedure/policy.
- Incorporate data, facts or pictures within this to convey your message.
- Below, add what your audience can do to fix or improve this. Give your viewers a call to action.
Check out this infographic from Canva!

Create an Easy to Understand Infographic
First, remember that your audience, especially when marketing, is diverse. Your infographic should be easily understood by everyone. Besides, unless you are specifically targeting a certain group in a controlled setting, your readability should be simple.
To add, even without a varied audience, you want simplicity. Infographics have limited space. Packing your image with too much text or too many images is confusing for anyone. On top of that, people want to be able to read the information not only easily, but quickly.
Furthermore, without the easy to understand model, your audience or potential audience, will seek the information elsewhere. To fix this, make sure you are using concise information. Your data points only need quick summaries. Ergo, focus more on headlines, singular data points, or attention grabbing sentences.
In summary, simplifying your information will allow your viewers to retain the information much better. Your audience is not looking to read or remember an essay. Find what is most important and break it down simply.
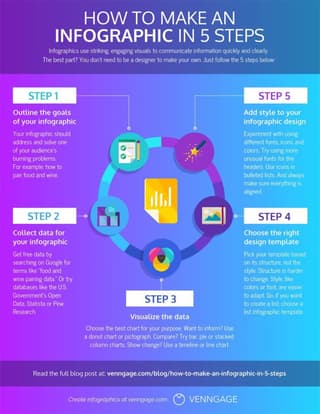
Check out this infographic from Penji!